Key Points
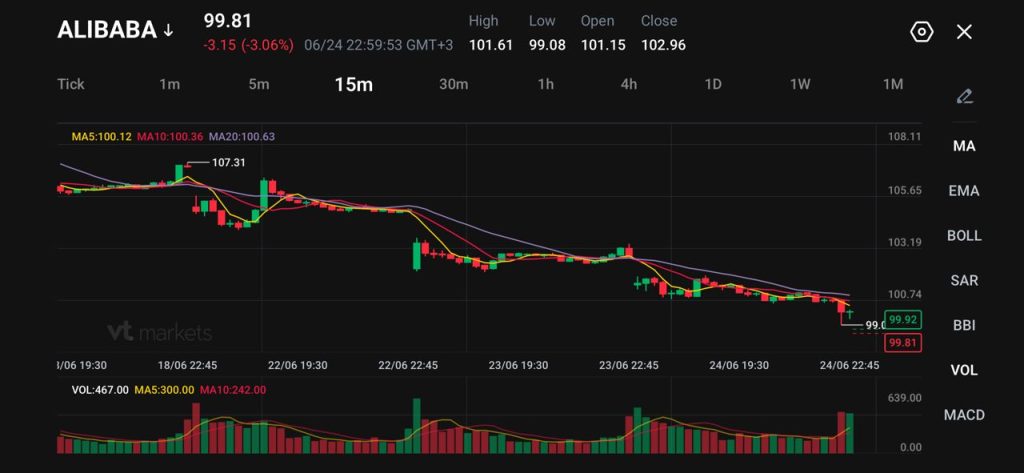
- Alibaba traded near $99.81, down 3.06%, after falling below the $100 level.
- Anthropic accused operators linked to Alibaba’s Qwen AI lab of using proxy accounts to access Claude at scale.
- Traders are watching $100.63 resistance and $99.08 support as the next short-term range.
Alibaba fell sharply after Anthropic accused the company of carrying out a large-scale campaign to access Claude, its flagship AI model.
The stock traded near $99.81, down 3.06%, after dropping from an intraday high of $101.61. The move pushed Alibaba below the psychological $100 level, adding pressure to an already weak short-term chart.
According to the claims, operators linked to Alibaba’s Qwen AI lab used nearly 25,000 proxy accounts and generated more than 28.8 million exchanges with Claude between April and June. Anthropic alleged the campaign targeted high-value features such as software engineering and agentic reasoning.
The news added fresh pressure to Chinese tech sentiment at a time when Washington is already tightening scrutiny around AI access, model distillation, and national security risks.
Why Traders Are Watching This
Traders are watching Alibaba because the story links together three major risks: AI competition, US-China tech tension, and regulatory pressure.
Anthropic accused Alibaba-linked operators of adversarial distillation, where outputs from a premium AI model are used to help train or improve rival systems. AI labs generally accept distillation for smaller models, but using it to replicate high-end model capabilities without authorisation can breach platform terms.
The claims also arrive as US lawmakers consider measures that could blacklist or sanction Chinese firms found to have accessed American AI technology illegally. That raises headline risk for Alibaba if the allegations gain traction in Washington.
Alibaba has already faced scrutiny from the US Department of Defence, which added the company to a blacklist over alleged ties to the Chinese military. Alibaba has denied those claims and filed a lawsuit seeking removal from the list.
For CFD traders, the immediate question is whether Alibaba can defend the $99 area or whether regulatory pressure pushes the stock into a deeper pullback.
Key Trading Levels
| Level | What Traders Are Watching |
| 107.31 | Previous upper swing and wider recovery level |
| 105.65 | Stronger recovery resistance |
| 103.19 | Mid-range resistance |
| 101.61 | Intraday high |
| 100.63 | 20-period moving average resistance |
| 100.36 | 10-period moving average |
| 100.12 | 5-period moving average |
| 99.81 | Current trade zone |
| 99.08 | Intraday low and key support |
| 99 | Psychological support |
Alibaba is trading below its short-term moving averages, with the 5-period MA at 100.12, the 10-period MA at 100.36, and the 20-period MA at 100.63.
That keeps the short-term bias tilted lower. The chart shows a steady downtrend from the $107.31 area, with sellers continuing to defend each rebound attempt.
A move back above $100.63 would suggest the stock is stabilising. A stronger recovery would need price to reclaim $101.61. On the downside, a break below $99.08 could bring fresh selling pressure and keep the stock below the $100 level.
Bullish and Bearish Setups
| Setup | Trigger | Potential Market Reaction |
| Bullish Recovery | Move Above 100.63 | Buyers may target 101.61 |
| Breakout Setup | Move Above 101.61 | Momentum may extend toward 103.19 |
| Pullback Setup | Hold Above 99.08 | Traders may watch for short-term stabilisation |
| Bearish Break | Move Below 99.08 | Sellers may target 99.00, then lower support |
The bullish setup depends on Alibaba reclaiming $100.63 and holding above the 20-period moving average. That would show buyers are returning after the AI-related selloff.
The stronger recovery setup needs a move above $101.61. If buyers clear that level, the stock could attempt a rebound toward $103.19.
The bearish setup builds if Alibaba breaks below $99.08. A move under that level would show that sellers remain in control and could extend pressure below the $100 zone.
Disclaimer
The price levels and trade scenarios above reflect the author’s view at the time of writing and do not represent financial advice or an official recommendation from VT Markets. Traders should conduct their own analysis and manage risk carefully.
Trade Alibaba CFDs With VT Markets
Alibaba remains active when traders react to Chinese tech regulation, AI competition, US-China policy risks, earnings expectations, and broader equity sentiment.
With VT Markets, traders can access Alibaba share CFDs alongside major indices, forex, gold, oil, ETFs, and other global CFD markets on a single platform. This helps traders follow Alibaba’s price action while also tracking related moves in China-linked equities, US tech sentiment, and broader risk appetite.
Use VT Markets’ charting tools to monitor support, resistance, moving averages, and breakout behaviour as the next Alibaba setup develops.
Create a live VT Markets account today to access our platform features, including market insights and educational content.
Why Trade Alibaba as a CFD?
Alibaba CFDs allow traders to take a view on rising or falling Alibaba price moves without owning the underlying shares.
That flexibility can be useful when the stock reacts quickly to regulatory headlines, AI-related claims, US-China tensions, earnings updates, and broader market volatility. If Alibaba breaks above resistance, traders can watch recovery setups. If pressure continues, traders can monitor downside continuation.
With VT Markets, traders can follow Alibaba price action in real time and compare it with other major CFD markets from one account.
What To Watch Next
Traders should watch $100.63 resistance and $99.08 support.
A break above $100.63 could support a recovery toward $101.61. A move below $99.08 would keep sellers in control and increase pressure below the $100 level.
Beyond the chart, the next drivers are Anthropic’s claims, any response from Alibaba, potential US legislative action, China tech sentiment, and broader risk appetite across global equities.
FAQs
Why Is Alibaba Falling?
Alibaba is falling after Anthropic accused operators linked to Alibaba’s Qwen AI lab of using proxy accounts to access Claude at scale. The claims added pressure to the stock as traders weighed US-China AI and regulatory risks.
What Is the Key Level to Watch for Alibaba?
The key upside level is $100.63, which marks the 20-period moving average. A move above this area could support a recovery toward $101.61. On the downside, $99.08 is the first major support level.
Can Alibaba Recover?
Alibaba could recover if buyers defend $99.08 and push price back above $100.63. A stronger rebound would need a break above $101.61 and calmer headlines around the Anthropic allegations.
What Could Push Alibaba Lower?
Alibaba could move lower if US lawmakers increase pressure on Chinese AI firms, Anthropic’s claims gain more attention, or broader China tech sentiment weakens. A break below $99.08 would strengthen the bearish setup.
Can I Trade Alibaba With VT Markets?
Yes. VT Markets offers access to Alibaba share CFDs, allowing traders to take a view on rising or falling Alibaba price moves without owning the underlying stock. Traders can also access forex, gold, oil, indices, ETFs, and other CFD markets from one platform.
Start trading now – Click here to create your real VT Markets account